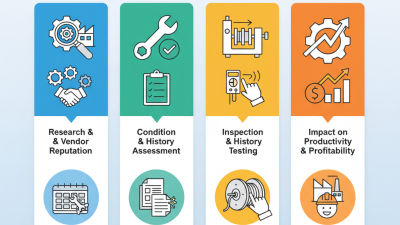
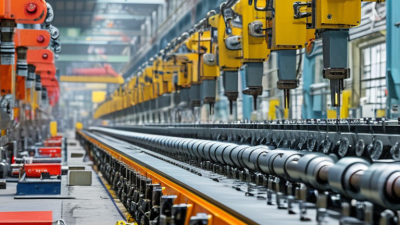
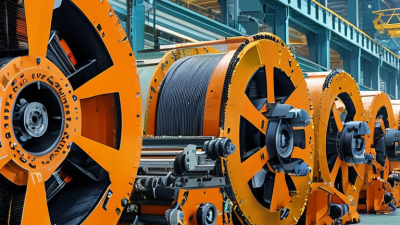
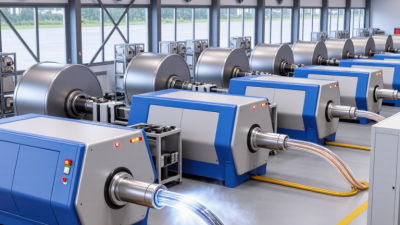
China’s cable machinery supports demanding production lines, from conductor drawing to extrusion, stranding, and final take-up. Reliable output depends on more than buying modern equipment. It depends on disciplined Cable Machinery Maintenance, accurate records, and trained technicians who understand each machine’s operating limits.
Industry forecasts show why this discipline matters. CRU’s Cable and Wire Industry Outlook 2024 links grid expansion, renewable projects, and electrification with sustained cable demand. The International Energy Agency’s Electricity 2024 report also expects global electricity consumption to grow strongly through 2026. More production pressure can mean shorter maintenance windows. Small defects then become expensive interruptions.
A practical program starts with visible details. Inspect cooling-water flow, gearbox temperature, bearing noise, and die alignment during every shift. Check lubricant condition before metal particles damage a reducer. Record vibration trends, not only sudden failures. The ISO 55001 asset-management approach supports this lifecycle thinking, while IEC 60204-1 guides electrical safety for machinery.
The uncomfortable truth is that a clean checklist is not enough. Operators may overlook unusual sounds when output targets rise. Maintenance intervals copied from manuals may also fail under dusty conditions, high humidity, or continuous operation. Each Chinese cable machine needs data-based adjustment. Compare motor current, line speed, product diameter, and scrap rates over time. Review those records with the manufacturer or qualified service engineers.
Preventive maintenance protects consistency, safety, and delivery credibility. It also exposes weak habits early. A missed grease point today can become tomorrow’s damaged bearing, unstable tension, and rejected cable. This guide explains how to build a practical maintenance routine for China top cable machinery.
How to Maintain China’s Top Cable Machinery
Maintaining high-performance cable machinery begins with a reliable asset register. ISO 55001 principles help teams connect equipment decisions with production value, risk, and lifecycle cost. Record each assembly, not only the complete line. A pay-off stand, tensioner, capstan, die holder, cooling unit, and control cabinet may need separate entries. Assign each item an owner, service history, operating limits, and failure consequences. A criticality score should consider safety, quality, downtime, replacement time, and detectability. This classification must reflect actual plant conditions. A theoretical score can mislead.
Tips: Inspect rotating assemblies during planned stops. Check bearing temperature, vibration, lubrication, and alignment. Keep calibrated tools nearby. Photograph unusual wear before cleaning it. Store essential seals, sensors, and coupling elements under controlled conditions. Spare parts without traceable specifications create hidden risk.
Use the criticality classes to shape maintenance intervals. High-criticality assemblies need condition monitoring and tested contingency plans. Medium-criticality items may follow preventive schedules. Low-criticality components can use run-to-failure controls when consequences remain acceptable. Review these decisions after every major fault or process change. Experienced technicians should validate the register against real machine behavior. Operators often notice a slight tension fluctuation before instruments report failure. Do not ignore that evidence. We once treated repeated die wear as a tooling issue, but unstable cooling was contributing to it. The classification improved only after maintenance, production, and engineering reviewed the same data. ISO 55001 supports this disciplined alignment, but it cannot replace practical judgment.
Maintaining high-performance cable machinery begins with verifying pay-off, tension, and take-up accuracy. Each setting should remain within ±1% of its target value during production. Do not trust the display alone. Compare it with calibrated gauges, load cells, and encoder readings. Check the machine while running, because empty-line tests can hide real variation.
Tips: Record the setpoint, measured value, line speed, and cable diameter. Inspect dancer rollers for dust, wear, or uneven movement. Confirm that the take-up reel sits firmly on its shaft. A small alignment error can create unstable tension and irregular winding. Keep calibration records with dates and operator notes.
From practical maintenance work, tension often changes after temperature rises or a reel becomes lighter. Pay-off brakes should respond smoothly, without sudden jumps. The take-up motor must follow speed changes without pulling the cable too tightly.
I have seen accurate settings fail because a loose connector affected the feedback signal. That detail is easy to miss. Recheck the system after cleaning, replacing sensors, or changing cable materials.
Also compare results across several runs, not one successful sample. A single perfect reading proves very little. Use trends to decide when adjustment is needed. Safety guards and emergency systems should remain functional throughout every inspection.
Precision cable machinery depends on small surfaces that operators often overlook. Dies and capstans deserve inspection before diameter variation appears in finished cable. A 0.02 mm diameter-wear tolerance should be treated as an internal control limit, not a universal rule. Confirm it against the cable design, material, and process requirements.
Measure die bores with calibrated pin gauges or an optical measuring system. Check capstan grooves with a suitable micrometer or profile gauge. Record readings at several positions, because wear is rarely even. Look for polished flats, sharp groove edges, scoring, and copper or polymer deposits. Clean surfaces before measurement. A dirty die can produce false readings. Replace or rework components when wear approaches the limit, rather than waiting for visible defects. That delay is a common mistake.
Tips: Inspect dies and capstans at the same temperature used for production. Keep a dated wear log with measurements, line speed, material, and cable diameter. Verify measuring tools regularly. Rotate capstans when the design allows it. Never force a damaged die back into service. A second measurement can prevent an expensive decision. If results seem inconsistent, stop and review the method; the instrument, not the component, may be the problem.
How to Maintain China Top Cable Machinery?
Motor vibration should be trended, not judged from one reading. ISO 20816-3:2022 evaluates machine vibration through RMS velocity at bearing housings. Measure horizontal, vertical, and axial directions. Keep speed, load, sensor position, and cable-line tension consistent. Otherwise, comparisons become unreliable.
ISO 20816 uses zones A, B, C, and D. Zone A normally represents new-machine performance. Zone B supports long-term operation. Zone C requires planned correction, while Zone D indicates potentially damaging vibration. The correct boundary depends on machine group, power, speed, and foundation. The standard should guide decisions, not replace engineering judgment. The International Energy Agency reports that motor systems consume a major share of global electricity, making small efficiency losses financially important. A 0.5 mm/s increase may seem minor, but repeated growth can signal looseness, imbalance, misalignment, or bearing wear. A clean reading can still mislead.
Tips: Record a baseline after commissioning. Set an internal alert when vibration rises 25% from baseline, even before crossing an ISO zone. Inspect couplings, anchor bolts, and bearing temperature together. Use the same technician when possible. Trend weekly during heavy production, then review monthly. Do not ignore unusual noise. I would also recheck the sensor mounting, because imperfect field measurements happen.
| Maintenance Dimension | Recommended Measurement Practice | Relevant Data or Limit | Interpretation for Cable Machinery | Recommended Maintenance Action |
|---|---|---|---|---|
| Primary vibration value | Measure overall vibration velocity as RMS in the radial and, where practical, axial directions at accessible bearing housings. | Velocity is normally reported in mm/s RMS over the applicable frequency range. | Useful for motors, gearboxes, capstans, take-up units, extruders, cooling-line drives and other rotating assemblies. | Use the same sensor locations, directions and operating conditions for every trend measurement. |
| Typical ISO 20816-3 application range | Use the standard only when the machine falls within its stated scope and the measurement is made on non-rotating parts near the bearings. | Commonly applicable to industrial machines above 15 kW with operating speeds from approximately 120 to 15,000 r/min. | Many cable-production drive systems may fall within this range, but small auxiliary devices or special machines may require another evaluation method. | Confirm machine power, speed, mounting arrangement and measurement location before applying generic limits. |
| Machine group classification | Classify the machine according to size and foundation or support stiffness. | Group 1: large machines with rated power above 300 kW or large electrical machines with shaft height generally above 315 mm. Group 2: machines above 15 kW and up to 300 kW, or electrical machines with shaft height from approximately 160 to 315 mm. | Large line drives and heavily mounted gear-motor systems may require Group 1 limits; most medium production drives are commonly assessed as Group 2 when the standard scope is met. | Record the selected group and support condition in the vibration database. |
| Group 2, rigid support | Compare the measured overall velocity RMS with the indicative zone boundaries below. | Zone A/B: 1.4 mm/s Zone B/C: 2.8 mm/s Zone C/D: 4.5 mm/s |
Applicable to Group 2 machines whose support structure is relatively stiff and does not significantly amplify vibration. | Investigate persistent readings above 2.8 mm/s and plan corrective work when readings approach or exceed 4.5 mm/s. |
| Group 2, flexible support | Compare the measured overall velocity RMS with the flexible-support boundaries. | Zone A/B: 2.3 mm/s Zone B/C: 4.5 mm/s Zone C/D: 7.1 mm/s |
Applicable where the machine or foundation has greater structural flexibility and vibration response. | Check alignment, looseness, soft foot, foundation resonance and coupling condition when values enter Zone C. |
| Group 1, rigid support | Apply the indicative Group 1 rigid-support boundaries when the machine meets the relevant classification. | Zone A/B: 2.3 mm/s Zone B/C: 4.5 mm/s Zone C/D: 7.1 mm/s |
Designed for larger machines installed on relatively rigid supports. | Use the machine-specific baseline first; investigate a sustained Zone C result rather than relying on a single reading. |
| Group 1, flexible support | Apply the indicative Group 1 flexible-support boundaries when the machine and support meet the relevant classification. | Zone A/B: 3.5 mm/s Zone B/C: 7.1 mm/s Zone C/D: 11.2 mm/s |
Used for larger machines where the support structure has a comparatively flexible dynamic response. | Escalate investigation when vibration enters Zone C and establish a controlled shutdown plan for Zone D conditions. |
| Zone A | Record the value as the normal operating condition when the machine is newly commissioned or demonstrably stable. | Below the applicable A/B boundary. | Healthy condition is likely, provided there are no abnormal spectra, temperatures, noises or process symptoms. | Continue routine trending and retain the value as a reference baseline. |
| Zone B | Continue operation while monitoring the trend and investigating changes from the established baseline. | From the A/B boundary up to the B/C boundary. | Generally acceptable for unrestricted long-term operation, subject to the machine design and operating history. | Review lubrication, alignment, balance, belt tension, coupling condition and mounting bolts during planned maintenance. |
| Zone C | Treat the condition as unsuitable for prolonged continuous operation without corrective planning. | From the B/C boundary up to the C/D boundary. | Indicates elevated vibration and increased risk of bearing, gear, coupling or structural damage. | Identify the cause, shorten inspection intervals and schedule corrective maintenance at the earliest practical opportunity. |
| Zone D | Stop or isolate the machine when safe and operationally feasible, following the plant risk assessment. | Above the applicable C/D boundary. | Vibration is sufficiently severe to risk machine damage or loss of operational integrity. | Inspect bearings, gears, shafts, couplings, foundations, guards and process-induced forces before restart. |
| Measurement locations | Use horizontal, vertical and axial points at the drive-end and non-drive-end bearing housings whenever access permits. | At least one repeatable point per accessible bearing location; use the same point ID for every inspection. | Directional differences can reveal looseness, misalignment, resonance or thrust-related problems. | Label points permanently and photograph the sensor position for repeatability. |
| Operating condition | Measure at a stable production speed, load, material throughput and temperature. | Record speed in r/min, load or current, line speed, product condition and measurement date. | Changes in polymer load, tension, cooling, take-up force or extrusion pressure can alter vibration independently of mechanical damage. | Compare like-for-like operating states and avoid mixing start-up, coast-down and full-load data. |
| Trend escalation | Evaluate the rate of increase, not only the absolute ISO zone. | A rapid increase from the established baseline warrants investigation even if the reading remains in Zone A or B. | Early-stage bearing faults, imbalance, looseness and alignment problems may be detected before a zone boundary is crossed. | Set site-specific alert levels using historical data, machine criticality and maintenance response time. |
| Complementary diagnostics | Combine overall vibration with spectrum, time waveform, envelope analysis, temperature, lubrication and acoustic observations. | ISO zone values alone do not identify the failure mode. | Gearmesh frequencies, bearing defect frequencies, harmonics and sidebands can distinguish common cable-machinery faults. | Use detailed condition monitoring before replacing components or changing alignment. |
| Acceptance of manufacturer limits | Use documented machine-specific limits when they are available and technically justified. | ISO 20816 indicative zones do not replace design, commissioning or contractual acceptance criteria. | Special drive trains, variable-speed systems, resonant structures and process-connected equipment may require additional limits. | Apply the more conservative technically justified limit and document the reason for any deviation. |
For high-end cable machinery in China, maintenance starts with a documented safety verification. Check IEC 60204-1 safeguards during commissioning and planned shutdowns. Inspect protective bonding, emergency stops, disconnecting devices, overcurrent protection, control circuits, and enclosure integrity. Record every test result. A visual check is not enough. Measure continuity and confirm that guards stop motion within the required control sequence. Keep electrical drawings beside the cabinet, not in a forgotten folder.
Track MTBF and MTTR by machine, shift, product, and failure mode.
MTBF equals operating hours divided by failures. MTTR equals repair hours divided by failures.
These figures expose weak bearings, unstable tension controls, and slow troubleshooting. The U.S. Department of Energy’s Operations & Maintenance Best Practices Guide reports that predictive maintenance can reduce maintenance costs by 8–12% compared with preventive maintenance. That benefit depends on accurate records. Ours are not always perfect. That deserves review.
OEE should use availability, performance, and quality. Industry benchmarking commonly treats 85% OEE as a world-class reference, with 90% availability, 95% performance, and 99.9% quality. Use it carefully. A fast line can hide excessive scrap.
Track scrap rate by kilogram, batch, and defect type, including insulation bubbles, diameter variation, and surface damage. Compare daily results with weekly trends. Then connect losses to maintenance work orders, operator adjustments, and material changes. This creates evidence for practical decisions, not attractive but incomplete dashboards.